Example 3: Global Sensitivity Analysis — Sobol with Multi-task Parallelization
This notebook runs a Sobol global sensitivity analysis on the virus-macrophage PhysiCell model using multi-task parallelization (multiple workers on a single machine). Sobol indices measure how much of the QoI variance is attributable to each parameter individually (S1, first-order) or including all its interactions (ST, total-order).
What you will learn:
How to generate quasi-random Sobol samples with
generate_samples(N)— total samples = N×(2D+2), where D = number of parametersHow
num_workerscontrols intra-node parallelization (for inter-node MPI see ex4)How to compute S1 and ST Sobol indices from time-series QoIs
How to assess replicate convergence using the relative MCSE
Parameters explored:
viral_replication_rate— rate of viral replication inside epithelial cellsmin_virion_count— minimum virion count required for macrophage recognition
import warnings
warnings.filterwarnings('ignore')

from uq_physicell import get_physicell
from uq_physicell.model_analysis import ModelAnalysisContext, calculate_qoi_statistics
import matplotlib.pyplot as plt

get_physicell(target_dir=".")

db_path = "ex3_PhysiCell_SA_MultiTask.db"
model_config = {"ini_path": "Model_Struct.ini", "struc_name": "physicell_model_2"}

# Global samplers (Sobol, LHS, etc.) use only lower_bound and upper_bound for sampling.
# ref_value is optional metadata stored in the DB for traceability.
params_info = {
    "viral_replication_rate": {"lower_bound": 0.05, "upper_bound": 0.20, "ref_value": 0.125},
    "min_virion_count":        {"lower_bound": 0.5,  "upper_bound": 1.5,  "ref_value": 1.0},
}

# df_cell → cell DataFrame, df_subs → substrate DataFrame (see ex1 for the full dispatch table)
qoi_funcs = {
    "epithelial_live": lambda df_cell: len(df_cell[(df_cell['dead'] == False) & (df_cell['cell_type'] == 'epithelial cell')]),
    "interferon_mean": lambda df_subs: df_subs['interferon'].mean(),
}
Generate samples and run simulations
With N=8 and D=2 parameters, Sobol generates N×(2D+2) = 48 samples. Each sample runs numReplicates times (set in Model_Struct.ini), so the total simulation count is 48 × numReplicates.
context = ModelAnalysisContext(db_path, model_config, "Sobol", params_info, qoi_funcs, num_workers=8)
context.generate_samples(N=8)
print(f"Generated {len(context.dic_samples)} samples — running with {context.num_workers} workers...")
context.run()
Summary statistics across replicates
from uq_physicell.model_analysis import calculate_qoi_statistics

# Load QoIs structure from db (This does NOT load the all mcds lists to avoid out of memory error)
df_summary_mean, df_summary_std, df_summary_mcse = calculate_qoi_statistics(db_path, qoi_funcs)
display(df_summary_mean)
No QoI data provided, calculating QoIs from the database...
All samples in Samples table have corresponding entries in Output table.
Extracting QoIs from DataFrame...
| epithelial_live_0 | epithelial_live_1 | epithelial_live_2 | epithelial_live_3 | epithelial_live_4 | epithelial_live_5 | epithelial_live_6 | epithelial_live_7 | epithelial_live_8 | interferon_mean_0 | ... | interferon_mean_8 | time_0 | time_1 | time_2 | time_3 | time_4 | time_5 | time_6 | time_7 | time_8 | |
|---|---|---|---|---|---|---|---|---|---|---|---|---|---|---|---|---|---|---|---|---|---|
| SampleID | |||||||||||||||||||||
| 0 | 1010.0 | 1010.0 | 1010.0 | 1010.0 | 1010.0 | 1010.0 | 1010.0 | 1010.0 | 1010.0 | 0.0 | ... | 0.000000e+00 | 0.0 | 360.0 | 720.0 | 1080.0 | 1440.0 | 1800.0 | 2160.0 | 2520.0 | 2880.0 |
| 1 | 1010.0 | 1010.0 | 1010.0 | 1010.0 | 1010.0 | 1010.0 | 1010.0 | 1010.0 | 1010.0 | 0.0 | ... | 0.000000e+00 | 0.0 | 360.0 | 720.0 | 1080.0 | 1440.0 | 1800.0 | 2160.0 | 2520.0 | 2880.0 |
| 2 | 1010.0 | 1006.6 | 1003.4 | 979.2 | 956.4 | 871.0 | 644.4 | 532.6 | 503.0 | 0.0 | ... | 2.754400e-03 | 0.0 | 360.0 | 720.0 | 1080.0 | 1440.0 | 1800.0 | 2160.0 | 2520.0 | 2880.0 |
| 3 | 1010.0 | 1007.6 | 1004.0 | 963.8 | 938.6 | 916.8 | 890.0 | 857.2 | 753.2 | 0.0 | ... | 1.130666e-02 | 0.0 | 360.0 | 720.0 | 1080.0 | 1440.0 | 1800.0 | 2160.0 | 2520.0 | 2880.0 |
| 4 | 1010.0 | 1010.0 | 1010.0 | 1010.0 | 1010.0 | 1010.0 | 1010.0 | 1010.0 | 1010.0 | 0.0 | ... | 0.000000e+00 | 0.0 | 360.0 | 720.0 | 1080.0 | 1440.0 | 1800.0 | 2160.0 | 2520.0 | 2880.0 |
| 5 | 1010.0 | 1006.0 | 970.6 | 935.6 | 826.4 | 654.0 | 373.0 | 210.6 | 186.2 | 0.0 | ... | 5.277111e-132 | 0.0 | 360.0 | 720.0 | 1080.0 | 1440.0 | 1800.0 | 2160.0 | 2520.0 | 2880.0 |
| 6 | 1010.0 | 1006.2 | 1002.8 | 969.2 | 931.8 | 795.8 | 605.6 | 471.2 | 345.8 | 0.0 | ... | 8.555571e-03 | 0.0 | 360.0 | 720.0 | 1080.0 | 1440.0 | 1800.0 | 2160.0 | 2520.0 | 2880.0 |
| 7 | 1010.0 | 1007.2 | 1003.4 | 1001.6 | 990.6 | 983.8 | 979.4 | 979.0 | 978.8 | 0.0 | ... | 2.727898e-135 | 0.0 | 360.0 | 720.0 | 1080.0 | 1440.0 | 1800.0 | 2160.0 | 2520.0 | 2880.0 |
| 8 | 1010.0 | 1010.0 | 1010.0 | 1010.0 | 1010.0 | 1010.0 | 1010.0 | 1010.0 | 1010.0 | 0.0 | ... | 0.000000e+00 | 0.0 | 360.0 | 720.0 | 1080.0 | 1440.0 | 1800.0 | 2160.0 | 2520.0 | 2880.0 |
| 9 | 1010.0 | 1010.0 | 1010.0 | 1010.0 | 1010.0 | 1010.0 | 1010.0 | 1010.0 | 1010.0 | 0.0 | ... | 0.000000e+00 | 0.0 | 360.0 | 720.0 | 1080.0 | 1440.0 | 1800.0 | 2160.0 | 2520.0 | 2880.0 |
| 10 | 1010.0 | 1008.2 | 1003.4 | 1000.8 | 996.0 | 992.0 | 991.0 | 991.0 | 991.0 | 0.0 | ... | 7.163952e-322 | 0.0 | 360.0 | 720.0 | 1080.0 | 1440.0 | 1800.0 | 2160.0 | 2520.0 | 2880.0 |
| 11 | 1010.0 | 1010.0 | 1010.0 | 1010.0 | 1010.0 | 1010.0 | 1010.0 | 1010.0 | 1010.0 | 0.0 | ... | 0.000000e+00 | 0.0 | 360.0 | 720.0 | 1080.0 | 1440.0 | 1800.0 | 2160.0 | 2520.0 | 2880.0 |
| 12 | 1010.0 | 1010.0 | 1010.0 | 1010.0 | 1010.0 | 1010.0 | 1010.0 | 1010.0 | 1010.0 | 0.0 | ... | 0.000000e+00 | 0.0 | 360.0 | 720.0 | 1080.0 | 1440.0 | 1800.0 | 2160.0 | 2520.0 | 2880.0 |
| 13 | 1010.0 | 1010.0 | 1010.0 | 1010.0 | 1010.0 | 1010.0 | 1010.0 | 1010.0 | 1010.0 | 0.0 | ... | 0.000000e+00 | 0.0 | 360.0 | 720.0 | 1080.0 | 1440.0 | 1800.0 | 2160.0 | 2520.0 | 2880.0 |
| 14 | 1010.0 | 1006.6 | 974.2 | 911.0 | 502.8 | 131.8 | 0.0 | 0.0 | 0.0 | 0.0 | ... | 7.163952e-322 | 0.0 | 360.0 | 720.0 | 1080.0 | 1440.0 | 1800.0 | 2160.0 | 2520.0 | 2880.0 |
| 15 | 1010.0 | 1006.2 | 971.4 | 922.6 | 424.0 | 170.4 | 38.2 | 0.0 | 0.0 | 0.0 | ... | 7.581826e-281 | 0.0 | 360.0 | 720.0 | 1080.0 | 1440.0 | 1800.0 | 2160.0 | 2520.0 | 2880.0 |
| 16 | 1010.0 | 1010.0 | 1010.0 | 1010.0 | 1010.0 | 1010.0 | 1010.0 | 1010.0 | 1010.0 | 0.0 | ... | 0.000000e+00 | 0.0 | 360.0 | 720.0 | 1080.0 | 1440.0 | 1800.0 | 2160.0 | 2520.0 | 2880.0 |
| 17 | 1010.0 | 1007.2 | 989.0 | 954.4 | 876.4 | 510.0 | 195.6 | 195.6 | 195.6 | 0.0 | ... | 7.163952e-322 | 0.0 | 360.0 | 720.0 | 1080.0 | 1440.0 | 1800.0 | 2160.0 | 2520.0 | 2880.0 |
| 18 | 1010.0 | 1005.6 | 1003.2 | 1001.4 | 990.4 | 984.8 | 982.8 | 982.4 | 982.4 | 0.0 | ... | 7.415100e-255 | 0.0 | 360.0 | 720.0 | 1080.0 | 1440.0 | 1800.0 | 2160.0 | 2520.0 | 2880.0 |
| 19 | 1010.0 | 1006.8 | 1003.4 | 1002.0 | 982.6 | 971.2 | 967.8 | 957.4 | 950.8 | 0.0 | ... | 1.482999e-04 | 0.0 | 360.0 | 720.0 | 1080.0 | 1440.0 | 1800.0 | 2160.0 | 2520.0 | 2880.0 |
| 20 | 1010.0 | 1010.0 | 1010.0 | 1010.0 | 1010.0 | 1010.0 | 1010.0 | 1010.0 | 1010.0 | 0.0 | ... | 0.000000e+00 | 0.0 | 360.0 | 720.0 | 1080.0 | 1440.0 | 1800.0 | 2160.0 | 2520.0 | 2880.0 |
| 21 | 1010.0 | 1010.0 | 1010.0 | 1010.0 | 1010.0 | 1010.0 | 1010.0 | 1010.0 | 1010.0 | 0.0 | ... | 0.000000e+00 | 0.0 | 360.0 | 720.0 | 1080.0 | 1440.0 | 1800.0 | 2160.0 | 2520.0 | 2880.0 |
| 22 | 1010.0 | 1007.0 | 1002.8 | 1001.0 | 989.2 | 986.0 | 983.2 | 978.4 | 974.2 | 0.0 | ... | 1.966063e-04 | 0.0 | 360.0 | 720.0 | 1080.0 | 1440.0 | 1800.0 | 2160.0 | 2520.0 | 2880.0 |
| 23 | 1010.0 | 1010.0 | 1010.0 | 1010.0 | 1010.0 | 1010.0 | 1010.0 | 1010.0 | 1010.0 | 0.0 | ... | 0.000000e+00 | 0.0 | 360.0 | 720.0 | 1080.0 | 1440.0 | 1800.0 | 2160.0 | 2520.0 | 2880.0 |
| 24 | 1010.0 | 1010.0 | 1010.0 | 1010.0 | 1010.0 | 1010.0 | 1010.0 | 1010.0 | 1010.0 | 0.0 | ... | 0.000000e+00 | 0.0 | 360.0 | 720.0 | 1080.0 | 1440.0 | 1800.0 | 2160.0 | 2520.0 | 2880.0 |
| 25 | 1010.0 | 1010.0 | 1010.0 | 1010.0 | 1010.0 | 1010.0 | 1010.0 | 1010.0 | 1010.0 | 0.0 | ... | 0.000000e+00 | 0.0 | 360.0 | 720.0 | 1080.0 | 1440.0 | 1800.0 | 2160.0 | 2520.0 | 2880.0 |
| 26 | 1010.0 | 1010.0 | 1010.0 | 1010.0 | 1010.0 | 1010.0 | 1010.0 | 1010.0 | 1010.0 | 0.0 | ... | 0.000000e+00 | 0.0 | 360.0 | 720.0 | 1080.0 | 1440.0 | 1800.0 | 2160.0 | 2520.0 | 2880.0 |
| 27 | 1010.0 | 1010.0 | 1010.0 | 1010.0 | 1010.0 | 1010.0 | 1010.0 | 1010.0 | 1010.0 | 0.0 | ... | 0.000000e+00 | 0.0 | 360.0 | 720.0 | 1080.0 | 1440.0 | 1800.0 | 2160.0 | 2520.0 | 2880.0 |
| 28 | 1010.0 | 1010.0 | 1010.0 | 1010.0 | 1010.0 | 1010.0 | 1010.0 | 1010.0 | 1010.0 | 0.0 | ... | 0.000000e+00 | 0.0 | 360.0 | 720.0 | 1080.0 | 1440.0 | 1800.0 | 2160.0 | 2520.0 | 2880.0 |
| 29 | 1010.0 | 1010.0 | 1010.0 | 1010.0 | 1010.0 | 1010.0 | 1010.0 | 1010.0 | 1010.0 | 0.0 | ... | 0.000000e+00 | 0.0 | 360.0 | 720.0 | 1080.0 | 1440.0 | 1800.0 | 2160.0 | 2520.0 | 2880.0 |
| 30 | 1010.0 | 1006.4 | 963.4 | 892.6 | 506.4 | 29.6 | 0.0 | 0.0 | 0.0 | 0.0 | ... | 7.163952e-322 | 0.0 | 360.0 | 720.0 | 1080.0 | 1440.0 | 1800.0 | 2160.0 | 2520.0 | 2880.0 |
| 31 | 1010.0 | 1006.8 | 970.4 | 883.6 | 451.4 | 102.6 | 0.0 | 0.0 | 0.0 | 0.0 | ... | 7.163952e-322 | 0.0 | 360.0 | 720.0 | 1080.0 | 1440.0 | 1800.0 | 2160.0 | 2520.0 | 2880.0 |
| 32 | 1010.0 | 1006.8 | 966.4 | 852.2 | 428.4 | 107.4 | 0.0 | 0.0 | 0.0 | 0.0 | ... | 7.163952e-322 | 0.0 | 360.0 | 720.0 | 1080.0 | 1440.0 | 1800.0 | 2160.0 | 2520.0 | 2880.0 |
| 33 | 1010.0 | 1005.8 | 966.6 | 896.8 | 563.0 | 152.8 | 0.0 | 0.0 | 0.0 | 0.0 | ... | 7.163952e-322 | 0.0 | 360.0 | 720.0 | 1080.0 | 1440.0 | 1800.0 | 2160.0 | 2520.0 | 2880.0 |
| 34 | 1010.0 | 1006.8 | 969.2 | 873.0 | 339.2 | 0.0 | 0.0 | 0.0 | 0.0 | 0.0 | ... | 7.163952e-322 | 0.0 | 360.0 | 720.0 | 1080.0 | 1440.0 | 1800.0 | 2160.0 | 2520.0 | 2880.0 |
| 35 | 1010.0 | 1006.8 | 973.4 | 830.2 | 182.8 | 0.0 | 0.0 | 0.0 | 0.0 | 0.0 | ... | 7.163952e-322 | 0.0 | 360.0 | 720.0 | 1080.0 | 1440.0 | 1800.0 | 2160.0 | 2520.0 | 2880.0 |
| 36 | 1010.0 | 1010.0 | 1010.0 | 1010.0 | 1010.0 | 1010.0 | 1010.0 | 1010.0 | 1010.0 | 0.0 | ... | 0.000000e+00 | 0.0 | 360.0 | 720.0 | 1080.0 | 1440.0 | 1800.0 | 2160.0 | 2520.0 | 2880.0 |
| 37 | 1010.0 | 1010.0 | 1010.0 | 1010.0 | 1010.0 | 1010.0 | 1010.0 | 1010.0 | 1010.0 | 0.0 | ... | 0.000000e+00 | 0.0 | 360.0 | 720.0 | 1080.0 | 1440.0 | 1800.0 | 2160.0 | 2520.0 | 2880.0 |
| 38 | 1010.0 | 1010.0 | 1010.0 | 1010.0 | 1010.0 | 1010.0 | 1010.0 | 1010.0 | 1010.0 | 0.0 | ... | 0.000000e+00 | 0.0 | 360.0 | 720.0 | 1080.0 | 1440.0 | 1800.0 | 2160.0 | 2520.0 | 2880.0 |
| 39 | 1010.0 | 1010.0 | 1010.0 | 1010.0 | 1010.0 | 1010.0 | 1010.0 | 1010.0 | 1010.0 | 0.0 | ... | 0.000000e+00 | 0.0 | 360.0 | 720.0 | 1080.0 | 1440.0 | 1800.0 | 2160.0 | 2520.0 | 2880.0 |
| 40 | 1010.0 | 1010.0 | 1010.0 | 1010.0 | 1010.0 | 1010.0 | 1010.0 | 1010.0 | 1010.0 | 0.0 | ... | 0.000000e+00 | 0.0 | 360.0 | 720.0 | 1080.0 | 1440.0 | 1800.0 | 2160.0 | 2520.0 | 2880.0 |
| 41 | 1010.0 | 1010.0 | 1010.0 | 1010.0 | 1010.0 | 1010.0 | 1010.0 | 1010.0 | 1010.0 | 0.0 | ... | 0.000000e+00 | 0.0 | 360.0 | 720.0 | 1080.0 | 1440.0 | 1800.0 | 2160.0 | 2520.0 | 2880.0 |
| 42 | 1010.0 | 1007.0 | 1003.0 | 988.4 | 973.8 | 967.0 | 947.2 | 914.0 | 786.4 | 0.0 | ... | 7.809332e-03 | 0.0 | 360.0 | 720.0 | 1080.0 | 1440.0 | 1800.0 | 2160.0 | 2520.0 | 2880.0 |
| 43 | 1010.0 | 1005.4 | 1003.0 | 973.6 | 950.0 | 860.0 | 540.4 | 323.0 | 254.2 | 0.0 | ... | 3.955079e-03 | 0.0 | 360.0 | 720.0 | 1080.0 | 1440.0 | 1800.0 | 2160.0 | 2520.0 | 2880.0 |
| 44 | 1010.0 | 1007.2 | 1004.4 | 972.8 | 951.6 | 929.8 | 828.8 | 690.8 | 677.4 | 0.0 | ... | 2.476701e-03 | 0.0 | 360.0 | 720.0 | 1080.0 | 1440.0 | 1800.0 | 2160.0 | 2520.0 | 2880.0 |
| 45 | 1010.0 | 1008.2 | 1004.2 | 984.8 | 965.8 | 947.6 | 861.8 | 713.4 | 641.0 | 0.0 | ... | 4.594867e-03 | 0.0 | 360.0 | 720.0 | 1080.0 | 1440.0 | 1800.0 | 2160.0 | 2520.0 | 2880.0 |
| 46 | 1010.0 | 1006.4 | 1002.8 | 960.8 | 942.4 | 835.2 | 659.0 | 481.8 | 188.2 | 0.0 | ... | 3.223069e-03 | 0.0 | 360.0 | 720.0 | 1080.0 | 1440.0 | 1800.0 | 2160.0 | 2520.0 | 2880.0 |
| 47 | 1010.0 | 1006.4 | 1003.0 | 967.6 | 939.2 | 841.0 | 664.6 | 525.0 | 185.2 | 0.0 | ... | 2.180510e-03 | 0.0 | 360.0 | 720.0 | 1080.0 | 1440.0 | 1800.0 | 2160.0 | 2520.0 | 2880.0 |
48 rows × 27 columns
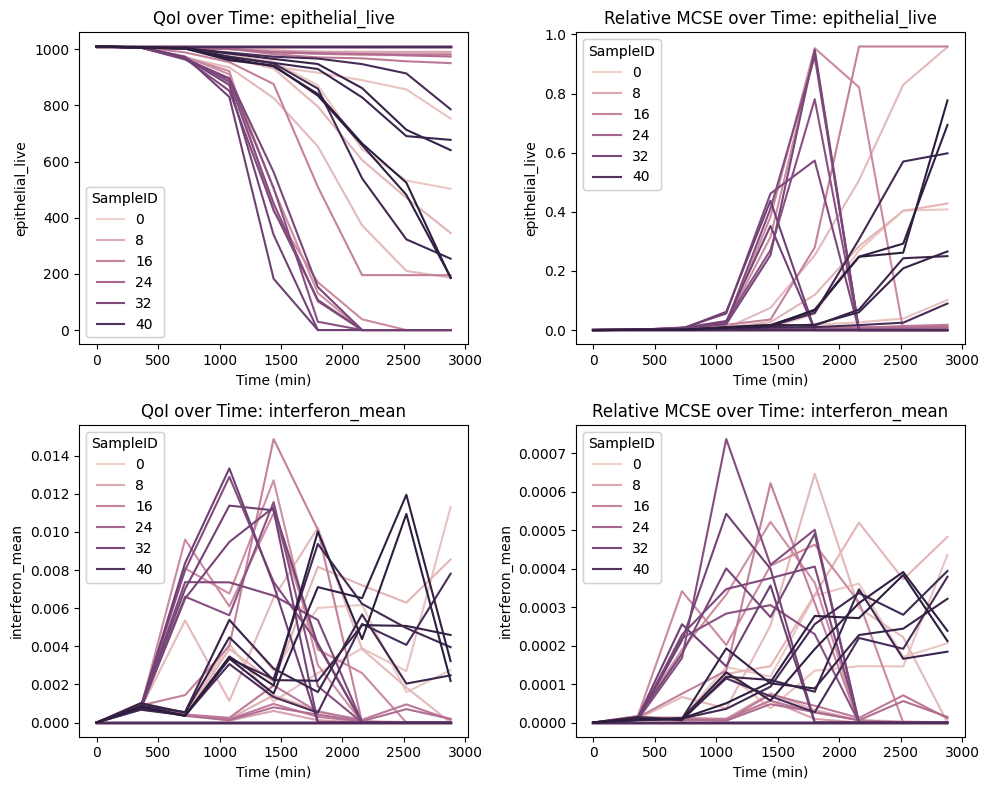
QoI over time and relative MCSE
Relative MCSE < 5% indicates the mean is reliable for SA. Values above 10% suggest more replicates are needed.
import matplotlib.pyplot as plt
from uq_physicell.model_analysis import plot_qoi_over_time

fig, axes = plt.subplots(len(qoi_funcs.keys()), 2, figsize=(10, 4*len(qoi_funcs.keys())))
for ax_id, qoi_name in enumerate(qoi_funcs.keys()):
    # Plot QoI time series
    plot_qoi_over_time(df_summary_mean, qoi_name, axes[ax_id,0])
    axes[ax_id,0].set_title(f"QoI over Time: {qoi_name}")
    # Plot mcse
    plot_qoi_over_time(df_summary_mcse, qoi_name, axes[ax_id,1])
    axes[ax_id,1].set_title(f"Relative MCSE over Time: {qoi_name}")

# Ensure proper layout and save the figure
plt.tight_layout()  # This will automatically adjust spacing to prevent overlaps
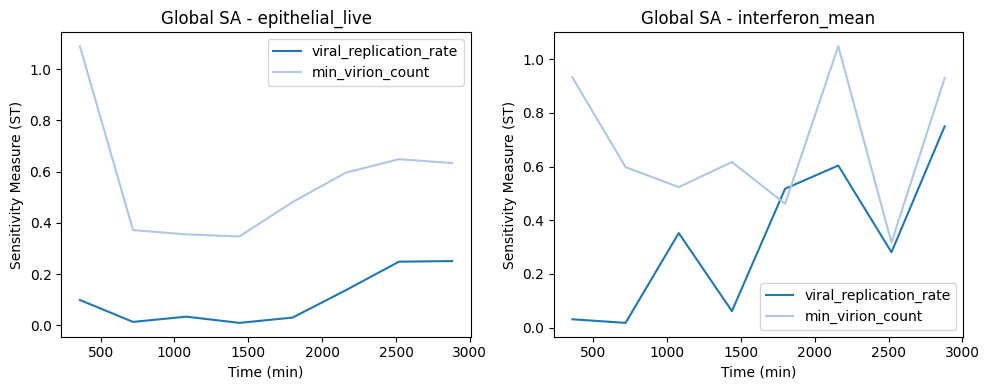
Sobol sensitivity indices (S1 and ST)
from uq_physicell.model_analysis import get_sa_results, plot_global_sa_results

sa_method = "Sobol Sensitivity Analysis"
qoi_names = list(qoi_funcs.keys())
sa_results, qoi_time_values = get_sa_results(db_path, qoi_names, df_summary_mean, sa_method)
param_names = list(params_info.keys())

# Plot Global SA results
fig, axes = plt.subplots(1, 2, figsize=(10, 4))
for ax_id, qoi_name in enumerate(qoi_funcs.keys()):
    plot_global_sa_results(param_names, sa_method, qoi_time_values, sa_results, qoi_name, 'ST' , axes[ax_id])
    axes[ax_id].set_title(f'Global SA - {qoi_name}')
    axes[ax_id].legend(loc='best')

plt.tight_layout()
Warning: Could not convert perturbation (None) to float for parameter viral_replication_rate.
Warning: Could not convert perturbation (None) to float for parameter min_virion_count.
Running sensitivity analysis with method: Sobol Sensitivity Analysis
Running Sobol Sensitivity Analysis for QoI: epithelial_live and time: 0.0
Running Sobol Sensitivity Analysis for QoI: epithelial_live and time: 360.0
Running Sobol Sensitivity Analysis for QoI: epithelial_live and time: 720.0
Running Sobol Sensitivity Analysis for QoI: epithelial_live and time: 1080.0
Running Sobol Sensitivity Analysis for QoI: epithelial_live and time: 1440.0
Running Sobol Sensitivity Analysis for QoI: epithelial_live and time: 1800.0
Running Sobol Sensitivity Analysis for QoI: epithelial_live and time: 2160.0
Running Sobol Sensitivity Analysis for QoI: epithelial_live and time: 2520.0
Running Sobol Sensitivity Analysis for QoI: epithelial_live and time: 2880.0
Running Sobol Sensitivity Analysis for QoI: interferon_mean and time: 0.0
Running Sobol Sensitivity Analysis for QoI: interferon_mean and time: 360.0
Running Sobol Sensitivity Analysis for QoI: interferon_mean and time: 720.0
Running Sobol Sensitivity Analysis for QoI: interferon_mean and time: 1080.0
Running Sobol Sensitivity Analysis for QoI: interferon_mean and time: 1440.0
Running Sobol Sensitivity Analysis for QoI: interferon_mean and time: 1800.0
Running Sobol Sensitivity Analysis for QoI: interferon_mean and time: 2160.0
Running Sobol Sensitivity Analysis for QoI: interferon_mean and time: 2520.0
Running Sobol Sensitivity Analysis for QoI: interferon_mean and time: 2880.0
Next: ex4 runs the same Sobol analysis using MPI — use that when simulations need to spread across multiple compute nodes.